Hello,
I am new user of Palabos and use it in my master’s thesis. Based on the example of an aneurysm, I create a flow through the coronary vessels. I would like to generate a multiblock graphic for my model - construction of the final block structure, which is based on a hierarchical process of refinement.
I would like to get exactly the same graphics as this one:
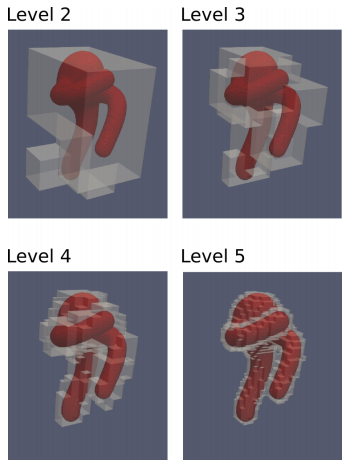
this is figure 2 from article: Chopard, Malaspinas, Ouared, Lagrava A Lattice Boltzmann Modeling of Bloodflow in Cerebral Aneurysms .
So far I have only been able to get this information for my model:
Size of the multi-block: 75-by-111-by-107
Number of atomic-blocks: 36
Smallest atomic-block: 25-by-22-by-21
Largest atomic-block: 25-by-23-by-22
Number of allocated cells: 0.426575 million
Fraction of allocated domain: 47.8881 percent
Number of fluid cells: 1822
I cannot draw the graphics. Please help me.
All the best
Asia